Copyright (C)  FastTrack.
Permission is granted to copy, distribute and/or modify this document.This program is distributed in the hope that it will be useful, but WITHOUT ANY WARRANTY; without even the implied warranty of MERCHANTABILITY or FITNESS FOR A PARTICULAR PURPOSE.
Get started with FastAnalysis
FastAnalysis is a python library that simplifies the importation of a tracking analysis performed with FastTrack. Easily select data for a given object or a given timepoint.
Package installation
The FastAnalysis package can be installed following the provided instruction at https://github.com/FastTrackOrg/FastAnalysis.
import sys
!{sys.executable} -m pip install fastanalysis
Package usage
import fastanalysis as fa
Load the tracking data and get the basic information.
data = fa.Load("tracking.txt")
print("Total objects: ", data.getObjectNumber())
Total objects: 14
print("Keys: ", data.getKeys())
Keys: ['xHead', 'yHead', 'tHead', 'xTail', 'yTail', 'tTail', 'xBody', 'yBody', 'tBody', 'curvature', 'areaBody', 'perimeterBody', 'headMajorAxisLength', 'headMinorAxisLength', 'headExcentricity', 'tailMajorAxisLength', 'tailMinorAxisLength', 'tailExcentricity', 'bodyMajorAxisLength', 'bodyMinorAxisLength', 'bodyExcentricity', 'imageNumber', 'id']
Select the tracking data for a given object
data.getObjects(0)
| xHead | yHead | tHead | xTail | yTail | tTail | xBody | yBody | tBody | curvature | ... | headMinorAxisLength | headExcentricity | tailMajorAxisLength | tailMinorAxisLength | tailExcentricity | bodyMajorAxisLength | bodyMinorAxisLength | bodyExcentricity | imageNumber | id | |
|---|---|---|---|---|---|---|---|---|---|---|---|---|---|---|---|---|---|---|---|---|---|
| 0 | 514.327 | 333.120 | 5.816190 | 499.960 | 327.727 | 6.102260 | 508.345 | 330.876 | 5.943950 | 0.000348 | ... | 2.98626 | 0.921388 | 11.40750 | 2.06461 | 0.983485 | 17.7578 | 2.86227 | 0.986924 | 0 | 0 |
| 14 | 512.965 | 332.575 | 5.866170 | 499.435 | 327.759 | 6.052000 | 507.626 | 330.673 | 5.951020 | 0.000370 | ... | 2.94920 | 0.921589 | 10.63010 | 1.79632 | 0.985619 | 16.5912 | 2.55900 | 0.988034 | 1 | 0 |
| 28 | 510.519 | 331.417 | 5.888830 | 495.784 | 327.366 | 6.128890 | 504.484 | 329.758 | 6.020880 | 0.000285 | ... | 3.02647 | 0.931937 | 11.80820 | 1.97610 | 0.985898 | 17.9581 | 2.76152 | 0.988106 | 2 | 0 |
| 42 | 508.379 | 330.542 | 5.978240 | 493.210 | 327.460 | 6.159440 | 502.213 | 329.291 | 6.083920 | 0.000217 | ... | 3.10027 | 0.928649 | 11.67010 | 1.97623 | 0.985558 | 18.0820 | 2.70641 | 0.988735 | 3 | 0 |
| 56 | 503.990 | 331.764 | 4.889370 | 496.990 | 322.509 | 6.183440 | 501.029 | 327.856 | 5.378760 | 0.001812 | ... | 2.92067 | 0.914680 | 8.25174 | 3.01276 | 0.930966 | 13.0947 | 5.19418 | 0.917965 | 4 | 0 |
| ... | ... | ... | ... | ... | ... | ... | ... | ... | ... | ... | ... | ... | ... | ... | ... | ... | ... | ... | ... | ... | ... |
| 2414 | 515.720 | 332.233 | 0.047758 | 504.152 | 332.758 | 6.219550 | 510.844 | 332.456 | 0.031550 | 0.000053 | ... | 2.83620 | 0.891031 | 7.96985 | 2.21498 | 0.960604 | 13.3794 | 2.48061 | 0.982662 | 195 | 0 |
| 2428 | 514.518 | 331.229 | 6.173800 | 502.533 | 333.448 | 0.410982 | 509.848 | 332.091 | 0.188133 | 0.000454 | ... | 3.01448 | 0.895229 | 9.27558 | 1.86710 | 0.979531 | 14.0909 | 3.11860 | 0.975201 | 196 | 0 |
| 2442 | 515.022 | 333.301 | 6.039930 | 503.432 | 330.360 | 6.110450 | 510.456 | 332.144 | 6.046190 | 0.000040 | ... | 2.86268 | 0.894578 | 8.45494 | 1.97392 | 0.972365 | 13.7423 | 2.44318 | 0.984069 | 197 | 0 |
| 2456 | 514.364 | 332.322 | 0.089009 | 501.409 | 333.271 | 6.061220 | 509.183 | 332.699 | 0.030277 | 0.000309 | ... | 2.70609 | 0.926143 | 9.87331 | 2.72056 | 0.961288 | 15.0990 | 3.04030 | 0.979518 | 198 | 0 |
| 2470 | 514.682 | 333.174 | 6.045460 | 503.418 | 331.482 | 0.110999 | 510.000 | 332.472 | 6.164560 | 0.000434 | ... | 2.90509 | 0.881178 | 8.31982 | 2.31197 | 0.960614 | 13.2119 | 2.86264 | 0.976245 | 199 | 0 |
190 rows × 23 columns
Select the tracking data for a list of objects
data.getObjects([0, 2, 4])
| xHead | yHead | tHead | xTail | yTail | tTail | xBody | yBody | tBody | curvature | ... | headMinorAxisLength | headExcentricity | tailMajorAxisLength | tailMinorAxisLength | tailExcentricity | bodyMajorAxisLength | bodyMinorAxisLength | bodyExcentricity | imageNumber | id | |
|---|---|---|---|---|---|---|---|---|---|---|---|---|---|---|---|---|---|---|---|---|---|
| 0 | 514.3270 | 333.120 | 5.816190 | 499.9600 | 327.727 | 6.102260 | 508.3450 | 330.876 | 5.943950 | 0.000348 | ... | 2.98626 | 0.921388 | 11.40750 | 2.06461 | 0.983485 | 17.7578 | 2.86227 | 0.986924 | 0 | 0 |
| 2 | 23.9978 | 287.715 | 3.706460 | 34.9722 | 278.836 | 3.998190 | 29.2056 | 283.505 | 3.848440 | 0.000714 | ... | 3.02224 | 0.878284 | 11.09250 | 2.61304 | 0.971858 | 16.5670 | 3.00962 | 0.983361 | 0 | 2 |
| 4 | 480.5800 | 213.482 | 1.282360 | 478.1250 | 228.520 | 1.533030 | 479.4280 | 220.543 | 1.425670 | 0.000539 | ... | 3.45208 | 0.873828 | 11.80360 | 2.22489 | 0.982075 | 17.9204 | 3.02978 | 0.985604 | 0 | 4 |
| 14 | 512.9650 | 332.575 | 5.866170 | 499.4350 | 327.759 | 6.052000 | 507.6260 | 330.673 | 5.951020 | 0.000370 | ... | 2.94920 | 0.921589 | 10.63010 | 1.79632 | 0.985619 | 16.5912 | 2.55900 | 0.988034 | 1 | 0 |
| 16 | 19.4579 | 293.022 | 4.288610 | 25.5579 | 281.206 | 4.183790 | 21.8962 | 288.302 | 4.233790 | 0.000041 | ... | 3.10527 | 0.893777 | 8.95453 | 1.95308 | 0.975924 | 15.1497 | 2.60690 | 0.985084 | 1 | 2 |
| ... | ... | ... | ... | ... | ... | ... | ... | ... | ... | ... | ... | ... | ... | ... | ... | ... | ... | ... | ... | ... | ... |
| 2449 | 477.5150 | 253.259 | 0.494507 | 466.0410 | 261.018 | 0.831531 | 472.8820 | 256.382 | 0.622416 | 0.000357 | ... | 3.18330 | 0.890322 | 9.94944 | 2.33195 | 0.972145 | 15.8464 | 3.12130 | 0.980409 | 198 | 2 |
| 2456 | 514.3640 | 332.322 | 0.089009 | 501.4090 | 333.271 | 6.061220 | 509.1830 | 332.699 | 0.030277 | 0.000309 | ... | 2.70609 | 0.926143 | 9.87331 | 2.72056 | 0.961288 | 15.0990 | 3.04030 | 0.979518 | 198 | 0 |
| 2462 | 413.9010 | 332.386 | 5.582420 | 401.1560 | 322.815 | 5.799440 | 408.5330 | 328.356 | 5.657920 | 0.000666 | ... | 3.24954 | 0.920555 | 11.51030 | 2.47230 | 0.976660 | 18.4979 | 3.05143 | 0.986300 | 199 | 4 |
| 2463 | 479.2630 | 250.716 | 0.644442 | 465.5060 | 258.476 | 0.362501 | 473.8190 | 253.784 | 0.503416 | 0.000200 | ... | 2.96435 | 0.930262 | 11.55250 | 1.76407 | 0.988273 | 18.1329 | 2.75170 | 0.988419 | 199 | 2 |
| 2470 | 514.6820 | 333.174 | 6.045460 | 503.4180 | 331.482 | 0.110999 | 510.0000 | 332.472 | 6.164560 | 0.000434 | ... | 2.90509 | 0.881178 | 8.31982 | 2.31197 | 0.960614 | 13.2119 | 2.86264 | 0.976245 | 199 | 0 |
544 rows × 23 columns
Select the tracking data for a given image
data.getFrames(100)
| xHead | yHead | tHead | xTail | yTail | tTail | xBody | yBody | tBody | curvature | ... | headMinorAxisLength | headExcentricity | tailMajorAxisLength | tailMinorAxisLength | tailExcentricity | bodyMajorAxisLength | bodyMinorAxisLength | bodyExcentricity | imageNumber | id | |
|---|---|---|---|---|---|---|---|---|---|---|---|---|---|---|---|---|---|---|---|---|---|
| 1220 | 471.9020 | 331.89000 | 0.269094 | 460.4110 | 335.5360 | 0.205151 | 467.340 | 333.3400 | 0.285930 | 0.000054 | ... | 3.02325 | 0.879342 | 9.4287 | 2.36285 | 0.968090 | 14.0688 | 2.71188 | 0.981246 | 100 | 0 |
| 1221 | 394.0560 | 311.18300 | 5.862420 | 380.7090 | 302.9660 | 5.533100 | 388.653 | 307.8680 | 5.710570 | 0.000782 | ... | 3.18665 | 0.911141 | 12.0567 | 2.13218 | 0.984238 | 18.0280 | 3.11668 | 0.984943 | 100 | 9 |
| 1222 | 294.9150 | 323.62100 | 5.928470 | 280.3880 | 319.3940 | 6.078460 | 289.216 | 321.9640 | 6.006340 | 0.000511 | ... | 3.08521 | 0.908041 | 11.1557 | 1.66443 | 0.988807 | 17.2867 | 2.57567 | 0.988838 | 100 | 2 |
| 1223 | 219.1200 | 191.08900 | 0.631238 | 205.3180 | 198.1280 | 0.088934 | 213.337 | 194.0410 | 0.437513 | 0.000843 | ... | 3.96058 | 0.881927 | 10.6798 | 3.26638 | 0.952081 | 17.7698 | 4.40737 | 0.968753 | 100 | 3 |
| 1224 | 191.9850 | 48.83960 | 1.338080 | 185.1600 | 62.8722 | 0.851539 | 188.648 | 55.6479 | 1.073240 | 0.001664 | ... | 3.49889 | 0.867101 | 12.0051 | 2.62074 | 0.975881 | 18.3914 | 3.78692 | 0.978572 | 100 | 5 |
| 1225 | 504.0520 | 9.82832 | 0.558700 | 489.4620 | 18.4243 | 0.514300 | 497.878 | 13.4694 | 0.531725 | 0.000089 | ... | 3.41134 | 0.912303 | 12.3365 | 1.99489 | 0.986839 | 19.5719 | 2.78473 | 0.989826 | 100 | 13 |
| 1226 | 304.1520 | 202.55400 | 5.721260 | 290.9760 | 193.5960 | 5.719690 | 298.600 | 198.7770 | 5.695240 | 0.000052 | ... | 3.28029 | 0.905315 | 11.6325 | 1.98547 | 0.985326 | 18.4733 | 2.68715 | 0.989364 | 100 | 7 |
| 1227 | 413.6920 | 329.85100 | 0.026077 | 399.8350 | 331.4840 | 0.161337 | 408.339 | 330.4820 | 0.113899 | 0.000115 | ... | 3.07354 | 0.914786 | 10.4648 | 1.93615 | 0.982736 | 16.1656 | 2.63191 | 0.986657 | 100 | 12 |
| 1228 | 84.2595 | 119.73900 | 3.797330 | 96.9216 | 110.7160 | 3.734220 | 90.450 | 115.3290 | 3.756420 | 0.000192 | ... | 3.52603 | 0.853670 | 12.6427 | 2.15830 | 0.985321 | 18.5339 | 2.84253 | 0.988169 | 100 | 10 |
| 1229 | 364.4060 | 35.89410 | 0.353083 | 348.8500 | 40.4274 | 6.276460 | 357.959 | 37.7740 | 0.251617 | 0.000484 | ... | 3.37384 | 0.920171 | 11.3458 | 3.33696 | 0.955770 | 18.6191 | 3.79543 | 0.979003 | 100 | 4 |
| 1230 | 490.6630 | 44.94220 | 0.503424 | 476.7040 | 52.5656 | 0.472187 | 485.125 | 47.9706 | 0.495529 | 0.000124 | ... | 3.27567 | 0.922368 | 10.9915 | 1.97134 | 0.983785 | 18.2792 | 2.72458 | 0.988829 | 100 | 11 |
| 1231 | 510.1740 | 40.70270 | 5.941170 | 497.3000 | 34.7202 | 5.673400 | 505.110 | 38.3486 | 5.830410 | 0.000431 | ... | 3.11621 | 0.902134 | 10.2866 | 2.08310 | 0.979281 | 16.2374 | 2.87259 | 0.984227 | 100 | 6 |
12 rows × 23 columns
Select the tracking data for a list of images
data.getFrames([100, 102])
| xHead | yHead | tHead | xTail | yTail | tTail | xBody | yBody | tBody | curvature | ... | headMinorAxisLength | headExcentricity | tailMajorAxisLength | tailMinorAxisLength | tailExcentricity | bodyMajorAxisLength | bodyMinorAxisLength | bodyExcentricity | imageNumber | id | |
|---|---|---|---|---|---|---|---|---|---|---|---|---|---|---|---|---|---|---|---|---|---|
| 1220 | 471.9020 | 331.89000 | 0.269094 | 460.4110 | 335.5360 | 0.205151 | 467.3400 | 333.3400 | 0.285930 | 0.000054 | ... | 3.02325 | 0.879342 | 9.42870 | 2.36285 | 0.968090 | 14.0688 | 2.71188 | 0.981246 | 100 | 0 |
| 1221 | 394.0560 | 311.18300 | 5.862420 | 380.7090 | 302.9660 | 5.533100 | 388.6530 | 307.8680 | 5.710570 | 0.000782 | ... | 3.18665 | 0.911141 | 12.05670 | 2.13218 | 0.984238 | 18.0280 | 3.11668 | 0.984943 | 100 | 9 |
| 1222 | 294.9150 | 323.62100 | 5.928470 | 280.3880 | 319.3940 | 6.078460 | 289.2160 | 321.9640 | 6.006340 | 0.000511 | ... | 3.08521 | 0.908041 | 11.15570 | 1.66443 | 0.988807 | 17.2867 | 2.57567 | 0.988838 | 100 | 2 |
| 1223 | 219.1200 | 191.08900 | 0.631238 | 205.3180 | 198.1280 | 0.088934 | 213.3370 | 194.0410 | 0.437513 | 0.000843 | ... | 3.96058 | 0.881927 | 10.67980 | 3.26638 | 0.952081 | 17.7698 | 4.40737 | 0.968753 | 100 | 3 |
| 1224 | 191.9850 | 48.83960 | 1.338080 | 185.1600 | 62.8722 | 0.851539 | 188.6480 | 55.6479 | 1.073240 | 0.001664 | ... | 3.49889 | 0.867101 | 12.00510 | 2.62074 | 0.975881 | 18.3914 | 3.78692 | 0.978572 | 100 | 5 |
| 1225 | 504.0520 | 9.82832 | 0.558700 | 489.4620 | 18.4243 | 0.514300 | 497.8780 | 13.4694 | 0.531725 | 0.000089 | ... | 3.41134 | 0.912303 | 12.33650 | 1.99489 | 0.986839 | 19.5719 | 2.78473 | 0.989826 | 100 | 13 |
| 1226 | 304.1520 | 202.55400 | 5.721260 | 290.9760 | 193.5960 | 5.719690 | 298.6000 | 198.7770 | 5.695240 | 0.000052 | ... | 3.28029 | 0.905315 | 11.63250 | 1.98547 | 0.985326 | 18.4733 | 2.68715 | 0.989364 | 100 | 7 |
| 1227 | 413.6920 | 329.85100 | 0.026077 | 399.8350 | 331.4840 | 0.161337 | 408.3390 | 330.4820 | 0.113899 | 0.000115 | ... | 3.07354 | 0.914786 | 10.46480 | 1.93615 | 0.982736 | 16.1656 | 2.63191 | 0.986657 | 100 | 12 |
| 1228 | 84.2595 | 119.73900 | 3.797330 | 96.9216 | 110.7160 | 3.734220 | 90.4500 | 115.3290 | 3.756420 | 0.000192 | ... | 3.52603 | 0.853670 | 12.64270 | 2.15830 | 0.985321 | 18.5339 | 2.84253 | 0.988169 | 100 | 10 |
| 1229 | 364.4060 | 35.89410 | 0.353083 | 348.8500 | 40.4274 | 6.276460 | 357.9590 | 37.7740 | 0.251617 | 0.000484 | ... | 3.37384 | 0.920171 | 11.34580 | 3.33696 | 0.955770 | 18.6191 | 3.79543 | 0.979003 | 100 | 4 |
| 1230 | 490.6630 | 44.94220 | 0.503424 | 476.7040 | 52.5656 | 0.472187 | 485.1250 | 47.9706 | 0.495529 | 0.000124 | ... | 3.27567 | 0.922368 | 10.99150 | 1.97134 | 0.983785 | 18.2792 | 2.72458 | 0.988829 | 100 | 11 |
| 1231 | 510.1740 | 40.70270 | 5.941170 | 497.3000 | 34.7202 | 5.673400 | 505.1100 | 38.3486 | 5.830410 | 0.000431 | ... | 3.11621 | 0.902134 | 10.28660 | 2.08310 | 0.979281 | 16.2374 | 2.87259 | 0.984227 | 100 | 6 |
| 1244 | 471.4650 | 333.53700 | 0.001856 | 455.8950 | 333.1370 | 0.067247 | 465.2880 | 333.3780 | 6.274380 | 0.000043 | ... | 3.02042 | 0.922201 | 11.22160 | 2.37528 | 0.977341 | 17.8254 | 2.66739 | 0.988741 | 102 | 0 |
| 1245 | 396.0970 | 314.66900 | 5.861210 | 381.8960 | 308.4470 | 5.874390 | 390.4180 | 312.1800 | 5.870340 | 0.000174 | ... | 3.30117 | 0.899737 | 11.37300 | 1.84361 | 0.986774 | 17.8003 | 2.68429 | 0.988564 | 102 | 9 |
| 1246 | 294.3930 | 324.25600 | 5.943700 | 279.2910 | 320.1950 | 6.066590 | 288.5890 | 322.6960 | 6.020880 | 0.000204 | ... | 3.05422 | 0.916951 | 11.74010 | 1.61688 | 0.990471 | 17.8923 | 2.52835 | 0.989966 | 102 | 2 |
| 1247 | 220.4620 | 188.58500 | 0.373316 | 205.5400 | 192.7970 | 0.203012 | 214.4550 | 190.2810 | 0.274169 | 0.000333 | ... | 4.10433 | 0.859915 | 10.67680 | 2.45992 | 0.973096 | 17.7399 | 3.50993 | 0.980231 | 102 | 3 |
| 1248 | 440.7830 | 245.34100 | 0.994409 | 432.8300 | 259.2290 | 1.086010 | 437.0160 | 251.9210 | 1.057480 | 0.000134 | ... | 3.14810 | 0.901165 | 12.80690 | 1.98403 | 0.987927 | 19.2185 | 2.57322 | 0.990996 | 102 | 8 |
| 1249 | 181.7160 | 48.26740 | 1.795220 | 183.2810 | 64.6947 | 1.403630 | 182.4580 | 56.2288 | 1.618700 | 0.003078 | ... | 3.54904 | 0.877756 | 13.01390 | 3.97463 | 0.952220 | 19.4517 | 4.32784 | 0.974935 | 102 | 5 |
| 1250 | 501.1650 | 7.83423 | 0.516324 | 484.9430 | 16.9856 | 0.489818 | 494.5580 | 11.5641 | 0.510098 | 0.000011 | ... | 3.43780 | 0.925195 | 12.71500 | 1.93735 | 0.988324 | 21.2212 | 2.82628 | 0.991092 | 102 | 13 |
| 1251 | 299.4490 | 204.64200 | 5.764900 | 288.1070 | 193.9180 | 5.171220 | 294.7050 | 200.1600 | 5.506650 | 0.004240 | ... | 3.51118 | 0.918436 | 10.65060 | 2.64429 | 0.968689 | 17.9687 | 4.10568 | 0.973546 | 102 | 7 |
| 1252 | 423.3440 | 226.69300 | 1.685010 | 423.8160 | 242.8190 | 1.563020 | 423.5670 | 234.3430 | 1.596200 | 0.000203 | ... | 3.48268 | 0.857366 | 12.90370 | 2.01238 | 0.987764 | 19.0144 | 2.79258 | 0.989156 | 102 | 1 |
| 1253 | 419.6690 | 331.30500 | 0.240837 | 405.4400 | 333.2920 | 6.160820 | 413.7010 | 332.1370 | 0.104904 | 0.000355 | ... | 3.16441 | 0.904444 | 10.92710 | 2.83584 | 0.965737 | 16.7111 | 3.40928 | 0.978968 | 102 | 12 |
| 1254 | 74.8227 | 119.96300 | 3.814450 | 87.7565 | 110.9120 | 3.722070 | 80.8288 | 115.7600 | 3.749350 | 0.000395 | ... | 3.66070 | 0.858662 | 12.48400 | 2.12660 | 0.985384 | 18.7389 | 2.97267 | 0.987337 | 102 | 10 |
| 1255 | 372.3560 | 33.29750 | 0.324467 | 357.0870 | 35.5002 | 6.115410 | 365.9440 | 34.2238 | 0.109167 | 0.000586 | ... | 3.46947 | 0.902759 | 11.64000 | 2.45400 | 0.977524 | 17.8863 | 3.81849 | 0.976946 | 102 | 4 |
| 1256 | 486.9070 | 43.34160 | 0.455006 | 472.0110 | 50.9601 | 0.484798 | 480.8850 | 46.4257 | 0.472028 | 0.000043 | ... | 3.40055 | 0.920011 | 10.94680 | 2.10120 | 0.981405 | 19.0397 | 2.83045 | 0.988888 | 102 | 11 |
| 1257 | 506.5980 | 42.84610 | 5.625700 | 494.8000 | 35.6051 | 5.914810 | 501.8730 | 39.9492 | 5.749680 | 0.000309 | ... | 3.31937 | 0.889443 | 9.90312 | 2.08601 | 0.977563 | 15.9151 | 3.01796 | 0.981856 | 102 | 6 |
26 rows × 23 columns
Select the tracking data for a list of images and a list of objects
data.getObjectsInFrames(ids=[0,2,4], indexes=[100,102])
| xHead | yHead | tHead | xTail | yTail | tTail | xBody | yBody | tBody | curvature | ... | headMinorAxisLength | headExcentricity | tailMajorAxisLength | tailMinorAxisLength | tailExcentricity | bodyMajorAxisLength | bodyMinorAxisLength | bodyExcentricity | imageNumber | id | |
|---|---|---|---|---|---|---|---|---|---|---|---|---|---|---|---|---|---|---|---|---|---|
| 1220 | 471.902 | 331.8900 | 0.269094 | 460.411 | 335.5360 | 0.205151 | 467.340 | 333.3400 | 0.285930 | 0.000054 | ... | 3.02325 | 0.879342 | 9.4287 | 2.36285 | 0.968090 | 14.0688 | 2.71188 | 0.981246 | 100 | 0 |
| 1222 | 294.915 | 323.6210 | 5.928470 | 280.388 | 319.3940 | 6.078460 | 289.216 | 321.9640 | 6.006340 | 0.000511 | ... | 3.08521 | 0.908041 | 11.1557 | 1.66443 | 0.988807 | 17.2867 | 2.57567 | 0.988838 | 100 | 2 |
| 1229 | 364.406 | 35.8941 | 0.353083 | 348.850 | 40.4274 | 6.276460 | 357.959 | 37.7740 | 0.251617 | 0.000484 | ... | 3.37384 | 0.920171 | 11.3458 | 3.33696 | 0.955770 | 18.6191 | 3.79543 | 0.979003 | 100 | 4 |
| 1244 | 471.465 | 333.5370 | 0.001856 | 455.895 | 333.1370 | 0.067247 | 465.288 | 333.3780 | 6.274380 | 0.000043 | ... | 3.02042 | 0.922201 | 11.2216 | 2.37528 | 0.977341 | 17.8254 | 2.66739 | 0.988741 | 102 | 0 |
| 1246 | 294.393 | 324.2560 | 5.943700 | 279.291 | 320.1950 | 6.066590 | 288.589 | 322.6960 | 6.020880 | 0.000204 | ... | 3.05422 | 0.916951 | 11.7401 | 1.61688 | 0.990471 | 17.8923 | 2.52835 | 0.989966 | 102 | 2 |
| 1255 | 372.356 | 33.2975 | 0.324467 | 357.087 | 35.5002 | 6.115410 | 365.944 | 34.2238 | 0.109167 | 0.000586 | ... | 3.46947 | 0.902759 | 11.6400 | 2.45400 | 0.977524 | 17.8863 | 3.81849 | 0.976946 | 102 | 4 |
6 rows × 23 columns
Check if a list of objects is in a frame
data.isObjectsInFrame(ids=[0,2,4], index=100)
[True, True, True]
Basic plotting
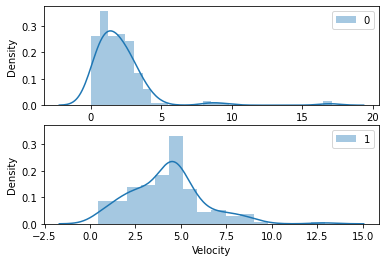
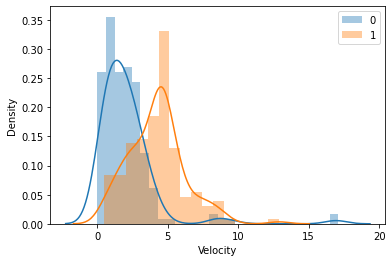
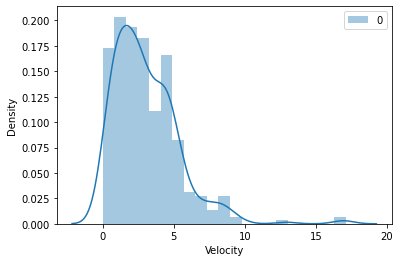
- Plot the velocity distribution for given objects
import matplotlib.pyplot as plt
%matplotlib inline

plotObj = fa.Plot(data)
plotObj.velocityDistribution(ids=[0, 1], key="Body", pooled=False, subplots=True);
plotObj.velocityDistribution(ids=[0, 1], key="Body", pooled=False, subplots=False);
plotObj.velocityDistribution(ids=[0, 1], key="Body", pooled=True);
Using seaborn on extracted data
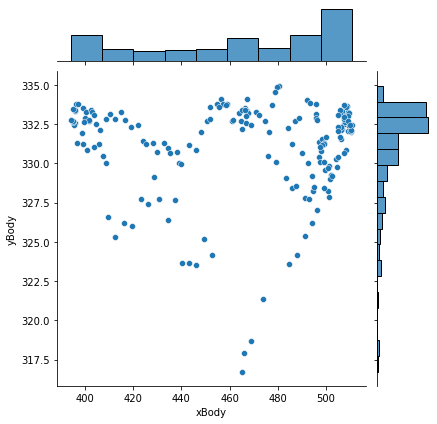
- Plot the distribution of positions.
import seaborn as sns

data_object_0 = data.getObjects(0)
sns.jointplot(data=data_object_0, x="xBody", y="yBody");
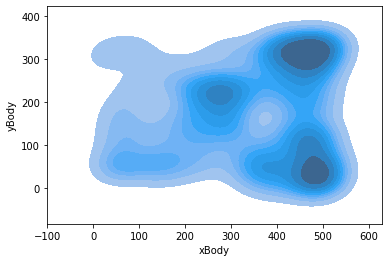
# All objects pooled
sns.kdeplot(data=data.getObjects(list(range(data.getObjectNumber()))), x="xBody", y="yBody", shade=True);
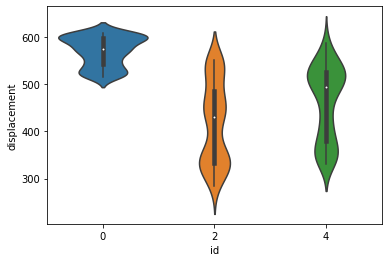
- Compare the distributions of displacements.
tmp = data.getObjects([0,2,4])
tmp["displacement"] = (tmp["xBody"]**2 + tmp["yBody"]**2)**0.5
sns.violinplot(data=tmp, x="id", y="displacement");
sns.boxplot(data=tmp, x="id", y="displacement");

sns.boxenplot(data=tmp, x="id", y="displacement");